Binomial Distribution Calculations In Matlab
Before
practicing the calculation of the Binom distribution to MATLAB. We should
discuss about the Variety of Bernoulli and Binom so that we understand the
benefits of binomic calculations applied to MATLAB software.
Suppose
we do an experiment whose results can be classified as "success"
"failure". If we take X = 1 to declare success and X = 0 for failure,
then the function of the chance mass is

in
this case p is the chance of "success" and 
A random X variable is called the Bernoulli random variable (named after the Swiss mathematician, James Bernoulli) if the mass function is given by Equation (1) for a certain value  .
.
.
Now
suppose we will do n free actions, each of which has the chance p to
"succeed" and 1-p to "fail". If X states how many times
there have been successes in these actions, then X is called the Binom Random
Variable with the parameter (n, p). So, the Bernoulli random variable is
nothing but a binomic random variable with parameters (1, p).
The probability mass function for a binom random variable with parameter (n, p) is
Equation (2) can be verified first by noting that the probability of a particular sequence of results of experiments containing success and failure is based on the assumption that actions are free or unbound,  .
.
.
Because there are  different
lines n the results of experiments that produce i success and n-i failure,
then prove equation (2).
different
lines n the results of experiments that produce i success and n-i failure,
then prove equation (2).
different
lines n the results of experiments that produce i success and n-i failure,
then prove equation (2).
As an
illustration, if n = 4, i = 2, then there are  ways,
ways,
ways,
(b,b,g,g),(b,g,b,g),(b,g,g,b),(g,b,b,g),(g,b,g,b),(g,g,b,b)
in
this case, for example, (b, b, g, g) means that the first two actions result in
success and the last two failures. Because every result of this experiment is
likely to occur as big as  , then
the chances of two successes from the four free actions are
, then
the chances of two successes from the four free actions are 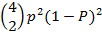 .
.
, then
the chances of two successes from the four free actions are .
Note that according to the binomic theorem, the sum of all these
opportunities is equal to one in other words,
Examples
of Binom Distribution Probability Calculations in MATLAB
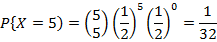
Five
equilibrium coins were thrown. If the experimental results are assumed to be
free, determine the mass function of the opportunity for the number of sides of
the image that appears.
Settlement;
If X states the number of sides of the image ("success") that appear,
then X is a binomic random variable with parameters (n = 5, p = 1/2).
Therefore, according to Equation 2.


Note:
n the number 0 results 1, and 0 factorial results 1, the  calculation
uses a combination calculation because the arrangement of images does not pay
attention to the sequence.
calculation
uses a combination calculation because the arrangement of images does not pay
attention to the sequence.
calculation
uses a combination calculation because the arrangement of images does not pay
attention to the sequence.
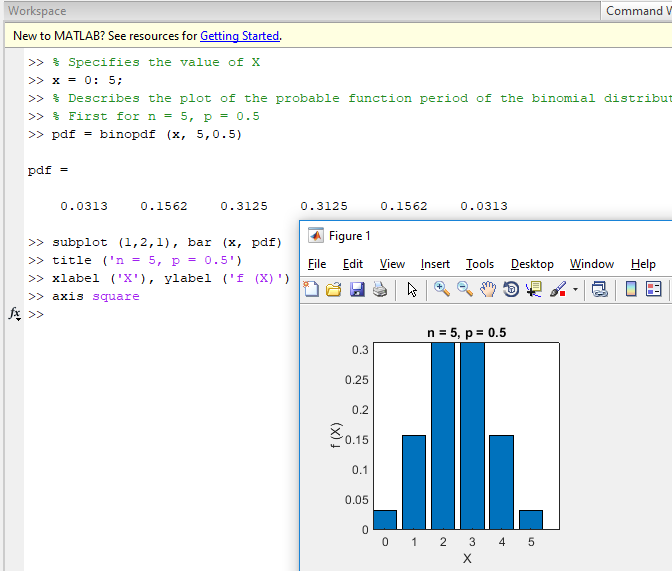
Now we
apply it to the calculation in MATLAB. Where we will match the results of the
manual calculation above with calculations using MATLAB, whether the results
are the same and make a plot (bar diagram) of the probability period function
of the binomial distribution with n = 5 and p = 0.5, writing the syntax in the
Command Window is,
% Specifies the value of X
x = 0: 5;
% Describes the plot of the
probable function period of the binomial distribution
% First for n = 5, p = 0.5
pdf = binopdf (x, 5,0.5)
pdf =
0.0313
0.1562 0.3125 0.3125
0.1562 0.0313
subplot (1,2,1), bar (x, pdf)
title ('n = 5, p =
0.5')
xlabel ('X'), ylabel ('f (X)')
axis square
SUBSCRIBE TO OUR NEWSLETTER
0 Response to "Binomial Distribution Calculations In Matlab"
Post a Comment