Cumulative Frequency Table (Less Than and Greater Than)
Presentation
of data in a frequency distribution is one of the usual first steps in
analyzing a data set. Interpreting data can usually be made easier if the data
is organized and simplified first. Frequency distribution is a table, where
data is grouped in several numerical intervals called classes. The form of this
table is very simple because it only presents the number of observations or
frequencies in each class interval.
Presentation
of the frequency table as stated in the frequency table in the previous article
or in the relative frequency table.

Relative
Frequency is the ratio between the frequency of each class with the total
frequency or the total number of observations. The relative frequency can be in
the form of a ratio or a proportion of the total frequency. Relative frequency
is very closely related to the distribution of opportunities. Therefore
relative frequencies are considered based on observational data. The relative
frequency distribution is also called the distribution of empirical
opportunities.
In
addition to these general and relative frequency distributions, we also know
cumulative frequencies. There are two kinds of cumulative frequencies, namely
cumulative frequencies which are increasing and decreasing. Increasing
cumulative frequencies are also called "frequencies less than",
whereas those that decrease increasingly are called "greater than
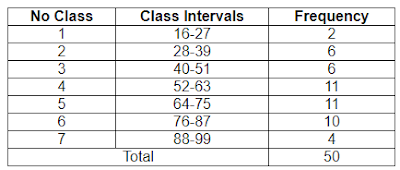
frequencies". As an example we will use the frequency table that has been
obtained from the results of calculations in the previous article to find the
cumulative value where the table table is as follows:

To
find the cumulative frequency value "less than" and "greater
than" requires 2 new columns, namely the lower and upper limit values. So
the table above becomes,
Note:
the
way to get the lower bound value is the lowest class interval of a certain
class number minus 0.5 => 16 - 0.5 = 15. 5.
While
the way to get the upper bound value is the highest class interval from a
certain class number plus 0.5 => 27 + 0.5 = 27.5.
From
the table above that displays the lower and upper limit values, a cumulative
frequency list of less than and more than the following can be made.
Explanation
of How to Make Cumulative Frequency Table:
To
make the cumulative frequency distribution table less than, we use the upper
edge.
- The first class uses the upper limit of the first class, the second class uses the upper limit of the second class, and so on.
- The first class has an upper limit of 27.5, so the cumulative frequency of data less than 27.5 is the first class frequency, which is 2.
- The second class has an upper limit of 39.5, so the cumulative frequency of data less than 39.5 is the frequency of the first class + the frequency of the second class, which is 2 + 6 = 8.
- The third class has an upper limit of 51.5, so the cumulative frequency of data less than 51.5 is the first class frequency + second class frequency + third class frequency, which is 3 + 6 + 6 = 14.
- And so on until the seventh class.
To
make the cumulative frequency distribution table more than, we use the lower
limit.
- The first class uses the lower limit of the first class, the second class uses the lower limit of the second class, and so on.
- The first class has a lower limit of 15.5, so the cumulative frequency of data over 15.5 is the frequency of the first class + frequency of the second class + frequency of the third class + ... + frequency of the seventh class = 2 + 6 + 6 + 11 + 11 + 10 + 4 = 50 (Total Frequency).
- The second class's lower limit is 27.5, so the cumulative frequency of data more than 27.5 is the second class frequency + third class frequency + ... + seventh class frequency = 6 + 6 + 11 + 11 + 10 + 4 = 48 => (Total - First Class Frequency) .
- And so on until the seventh class.
SUBSCRIBE TO OUR NEWSLETTER

0 Response to "Cumulative Frequency Table (Less Than and Greater Than)"
Post a Comment