Find the Quadratic Equation of the Graph of Quadratic Functions
Previously, it was
discussed how to draw a parabolic graph of quadratic functions based on
equations with intersection values, extreme points and discrimination. But the
times that will be discussed are the opposite of the previous process, which is
Determining the Quadratic Equation Based on the known Quadratic Function Graph.
Where the graph of quadratic functions has or certain properties that you must
understand before determining which formula is right to use
1. The graph of the quadratic
function intersects the X axis at (x1, 0) and (x2, 0) and
through any point (x3, y3) on the graph, then the
equation of the quadratic function can be determined by the formula,
y = f(x) = a(x- x1)(x
– x2)
The value of a is determined by entering the arbitrary point to x and y.
Where does this formula come from,
Y = f(x) = ax2
+ bx + c
Because
then,
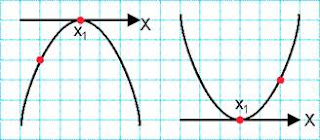
2. The graph of the quadratic
function alludes to the x axis at (x1, 0) and through one arbitrary
point, then the equation of the quadratic function can be determined by the
formula,
y = f(x) = a(x- x1)2
The formula y = f(x) =
a(x- x1)2 is formed from the previous formula namely y =
f(x) = a(x- x1)(x – x2) but because the values of x1
and x2 are the same then the formula becomes,
y = f(x) = a(x- x1)(x
– x1) = a(x- x1)2
The value of a is
determined by entering the arbitrary point to x and y.
3. The graph of the quadratic function through the cusp or
turning point (Xp, Yp) and through a certain point, then
the equation of the quadratic function can be determined by the formula,
y = f(x) = a(x- xp)2
+ yp
how this formula is formed
is
Note the factoring results below,
4. Graph of quadratic
functions through three arbitrary points, namely (x1, y1),
(x2, y2), and (x3, y3), then the
equation of the quadratic function can be determined by the formula.
y = f(x) = ax2 + bx + c
with values a, b and c
determined after
Example 1.
Find the quadratic function equation from the parabolic chart sketch in figure-3 below,
If we look at Figure-3,
the known value is,
The intersection of the X
axis: (-2, 0) and through a certain point, namely
Extreme points: (1, -4) = (xp,
yp) = (peak point, turning point / extreme)
So to find the values a
and b, use the formula
Y = ax2 + bx +
c is to use a formula
y = f(x) = a(x- xp)2
+ yp
Substitute the value of x,
xp and yp to the formula equation of the quadratic
function,
0 = a ((- 2) - 1) 2 + (-4)
0 = a (-3) 2-4
0 = 9a - 4
a = 4/9
the parabolic equation
sought is
Example 2.
Find the parabolic
equation through points (1, 3), (2, -1), and (4, 3). Because the line through
three points is arbitrary, the formula used is
y = f(x) = ax2 + bx + c
Through points (1, 3) the
equation obtained is
3= a(1)2 + b(1)
+ c
a + b + c = 3 ………………….(1)
Through point (2, -1) the
equation obtained is
-1 = a(2)2 +
b(2) + c
4a + 2b + c = -1………………(2)
Through points (4, 3) the
equation obtained is
3 = a(4)2 +
b(4) + c
16a + 4b + c = 3 …………….(3)
Do the solution to
equations (1), (2), and (3) using the elimination method so the results
obtained are
a = 2 b = -10 c = 11
The parabolic equation you
are looking for is
y = f(x) = ax2 + bx + c
y = f(x) = 2x2 -10x + 11
SUBSCRIBE TO OUR NEWSLETTER


0 Response to "Find the Quadratic Equation of the Graph of Quadratic Functions"
Post a Comment